Eliminate Risk of Failure with IIBA CBDA Exam Dumps
Schedule your time wisely to provide yourself sufficient time each day to prepare for the IIBA CBDA exam. Make time each day to study in a quiet place, as you'll need to thoroughly cover the material for the Certification in Business Data Analytics exam. Our actual IIBA Specialized Business Analysis Certifications exam dumps help you in your preparation. Prepare for the IIBA CBDA exam with our CBDA dumps every day if you want to succeed on your first try.
All Study Materials
Instant Downloads
24/7 costomer support
Satisfaction Guaranteed
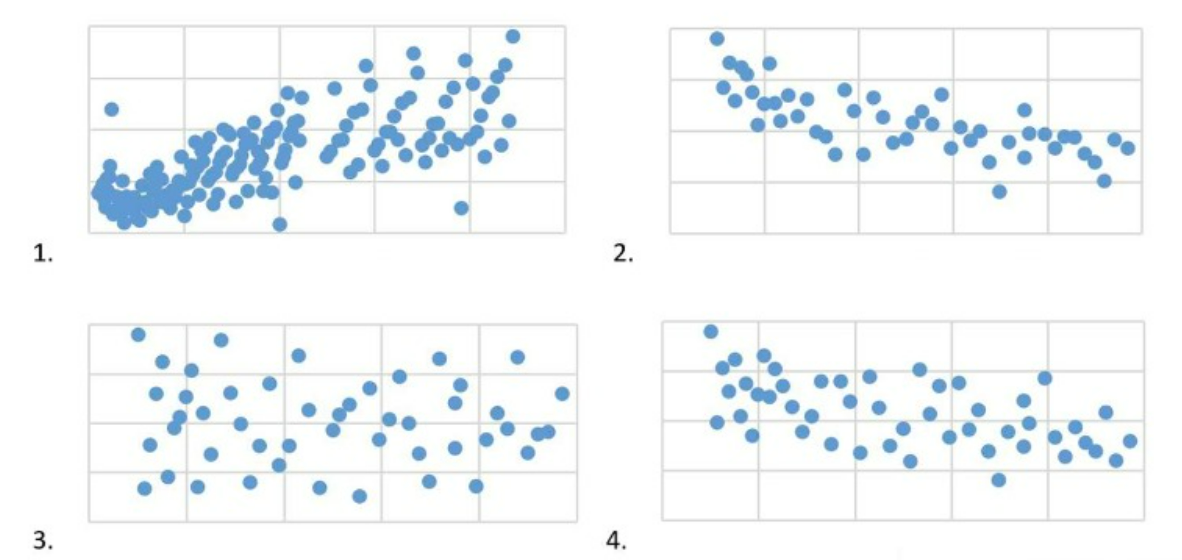
A data scientist is analyzing a dataset to determine if there is a strong relationship between two variables. A measure of covariance is done. Which of the following graphs indicate Zero Covariance between variables?
See the explanation below.
Covariance measures the directional relationship between the returns on two assets. A positive covariance means that asset returns move together while a negative covariance means they move inversely. Zero covariance indicates that the returns on the two assets move independently of each other. In the context of a scatter plot, zero covariance is represented by a plot where the points do not show any upward or downward trend but are rather scattered randomly on the graph with no discernible pattern.
Graph 4 displays such a pattern where there is no apparent relationship between the variables on the x and y axes, indicating that there is zero covariance between them.
An analyst is doing a clinical study on the value of analyte among a large population of healthy people. The analyst is going to use a Gaussian Distribution to share the results. Which of the following represents a Gaussian Distribution?

See the explanation below.
The Gaussian distribution, also known as the normal distribution, is a probability distribution that is symmetric about the mean, showing that data near the mean are more frequent in occurrence than data far from the mean. In graph form, the Gaussian distribution will appear as a bell curve, which is the case with option A. It is characterized by its bell-shaped curve and is defined by the mean () and the standard deviation (). It is a common assumption for the distribution of independent, randomly generated variables.
An analyst is working through data on comparing performance scores in different schools across the state, for ranking purposes. Since there is a lot of data and some extreme outliers, the analyst is trying to determine which type of statistical average would best represent the results. Which of the following is a concern when relying too heavily on summary statistics during data analysis?
See the explanation below.
Summary statistics are numerical measures that describe certain characteristics of a data set, such as the mean, median, mode, standard deviation, range, or quartiles. Summary statistics can help simplify and communicate complex data, but they can also obscure or distort important information, such as the distribution, shape, outliers, or trends of the data. Contextualization is the process of providing relevant background information, assumptions, limitations, or explanations for the data analysis and its results. Contextualization can help avoid misinterpretation, confusion, or bias when using summary statistics. Contextualization can also help connect the data analysis to the business problem, objectives, and stakeholders.
After completing their data analysis, an analyst is drawing out the results, explaining the methods and processes used, and identifying any limitations or weaknesses in the data or methods applied. While performing these steps, which recommended practice would the analyst apply?
An analyst is performing regression analysis and reviewing the results. They would like to rescale the variables in the model to more clearly reflect the relationship between the regression coefficients. Which technique could be used to rescale the variables?
Are You Looking for More Updated and Actual IIBA CBDA Exam Questions?
If you want a more premium set of actual IIBA CBDA Exam Questions then you can get them at the most affordable price. Premium IIBA Specialized Business Analysis Certifications exam questions are based on the official syllabus of the IIBA CBDA exam. They also have a high probability of coming up in the actual Certification in Business Data Analytics exam.
You will also get free updates for 90 days with our premium IIBA CBDA exam. If there is a change in the syllabus of IIBA CBDA exam our subject matter experts always update it accordingly.